Tax revenues stabilise in OECD countries in 2010
 0 Comment(s)
 Print
Print E-mail
China.org.cn, November 30, 2011
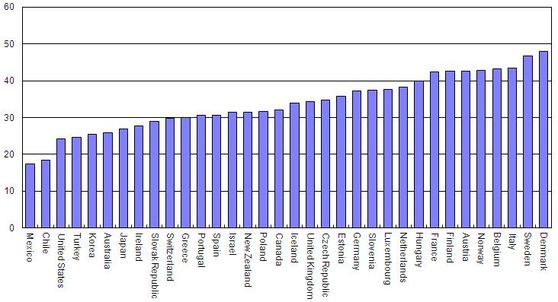
New OECD data in the annual Revenue Statistics publication showed that the majority of OECD governments stabilised their tax to GDP, with the average ratio moving up slightly from 33.8% in 2009 to 33.9%? in 2010.
 |
|
Total tax revenue as percentage of GDP, 2009. Countries have been ranked by their total tax revenue to GDP ratios.? |
That’s still down from 34.6% in 2008 and well below the most recent high point of 2007 when tax to GDP ratios averaged 35.2%.
OECD countries acknowledge that taxes must play a role in the process of fiscal consolidation as they battle unprecedented budget deficits.
The underlying message from these comparisons is complex, as changes in tax revenues reflect not only changes in economic activity but also policy measures.
In those European countries most affected by the financial crisis and subsequent recession there was an initial sharp fall in tax revenues but then a small recovery in the tax to GDP ratio in 2010.
The data collected also show that in a period when all levels of government have seen pressure on expenditure and revenues, the average tax ratio for state, regional and local governments has remained steady since 2007 while that for central government has declined.?
Out of 30 OECD countries for which provisional 2010 figures are available, tax-to-GDP ratios rose in 17 and fell in 13.
Go to Forum >>0 Comment(s)
 Add your comments...
- User Name Required
- Your Comment
- Racist, abusive and off-topic comments may be removed by the moderator.


