VI. Development Trend Analysis of Top 500 Service Companies of China in 2010
1. The total revenue of China's top 500 service companies has increased for six consecutive years, from 5.6872 trillion yuan in 2005 to 11.6334 trillion yuan in 2010. This represents a 104.2 percent increase over six years. Details are in?Figure 3-1.
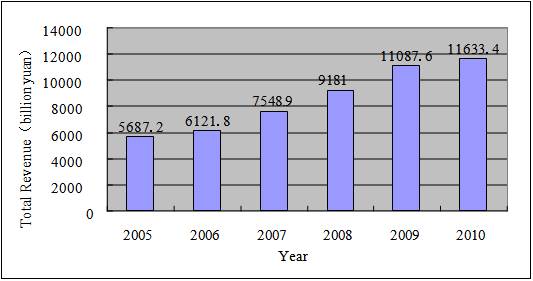
Figure 3-1. Revenue of China's top 500 service companies from 2005 to 2010
The threshold for being listed in the top 500 has also increased, from 505.61 million yuan in 2005 to 994.10 million yuan in 2010, up 96.6 percent. Details are in?Figure 3-2.
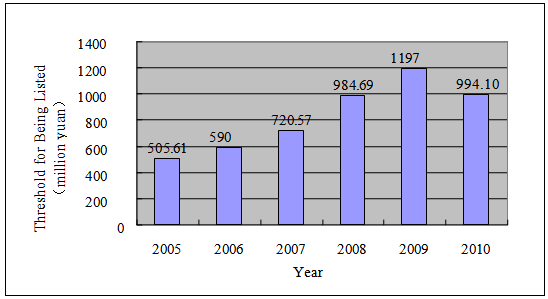
Figure 3-2. Threshold to top 500 service companies from 2005 to 2010
2. The average asset of China's top 500 service companies increased from 60.3 billion yuan in 2005 to 147.5 billion yuan in 2010, up 144.6 percent over six years.
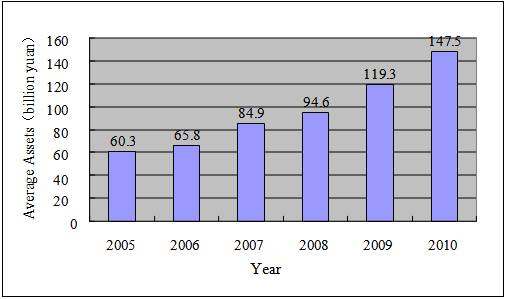
Figure 3-3. Average assets of China's top 500 service companies from 2005 to 2010
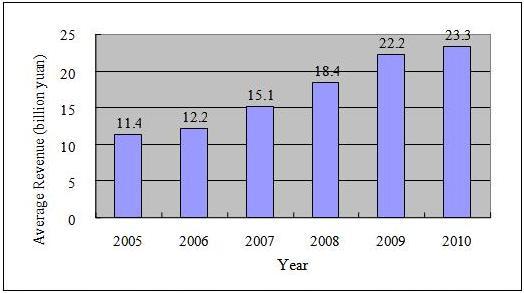
The average revenue of China's top 500 service companies has increased from 11.4 billion yuan in 2005 to 23.3 billion yuan in 2010, up 104.4 percent.
Figure 3-4. Average revenue of China's top 500 service companies from 2005 to 2010
The average profit has increased quickly, from 516 million yuan in 2005 to 1.73 billion yuan in 2010, up 235.3 percent.
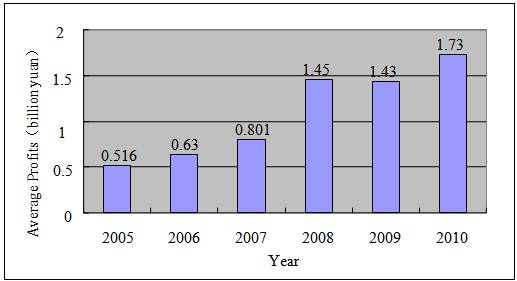
Figure 3-5. Average profits of China's top 500 service companies from 2005 to 2010
3. The average profit rate of assets has increased slowly, from 0.87 percent in 2005 to 1.17 percent in 2010. The average profit rate of revenue has increased from 4.59 percent to 7.39 percent. The average profit rate of net assets has declined from 11.14 percent to 9.55 percent.
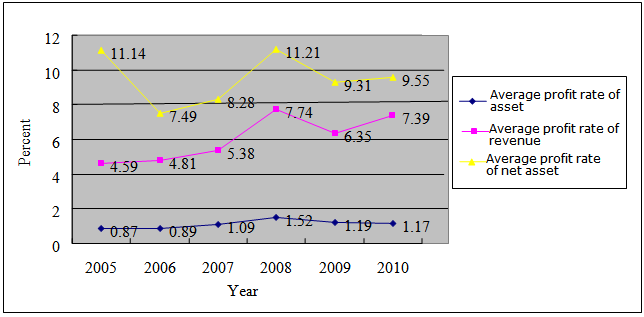
Figure 3-6. Average efficiency of China's top 500 service companies from 2005 to 2010
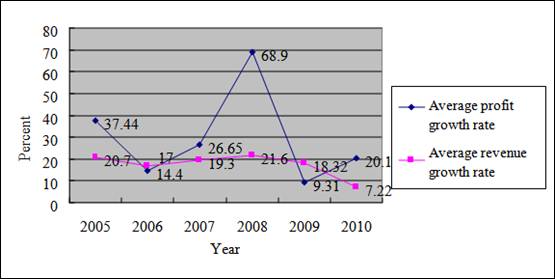
Figure 3-7. Average growth of China's top 500 service companies from 2005 to 2010
?
|
Summary |
|
|
Chapter I. |
|
|
Chapter II. |
|
|
Chapter III. |
|
|
Chapter IV. |
|
|
Chapter V. |
|
|
Chapter VII. |
 0
0 


